May 2016
30
D
evelopment
T
ools
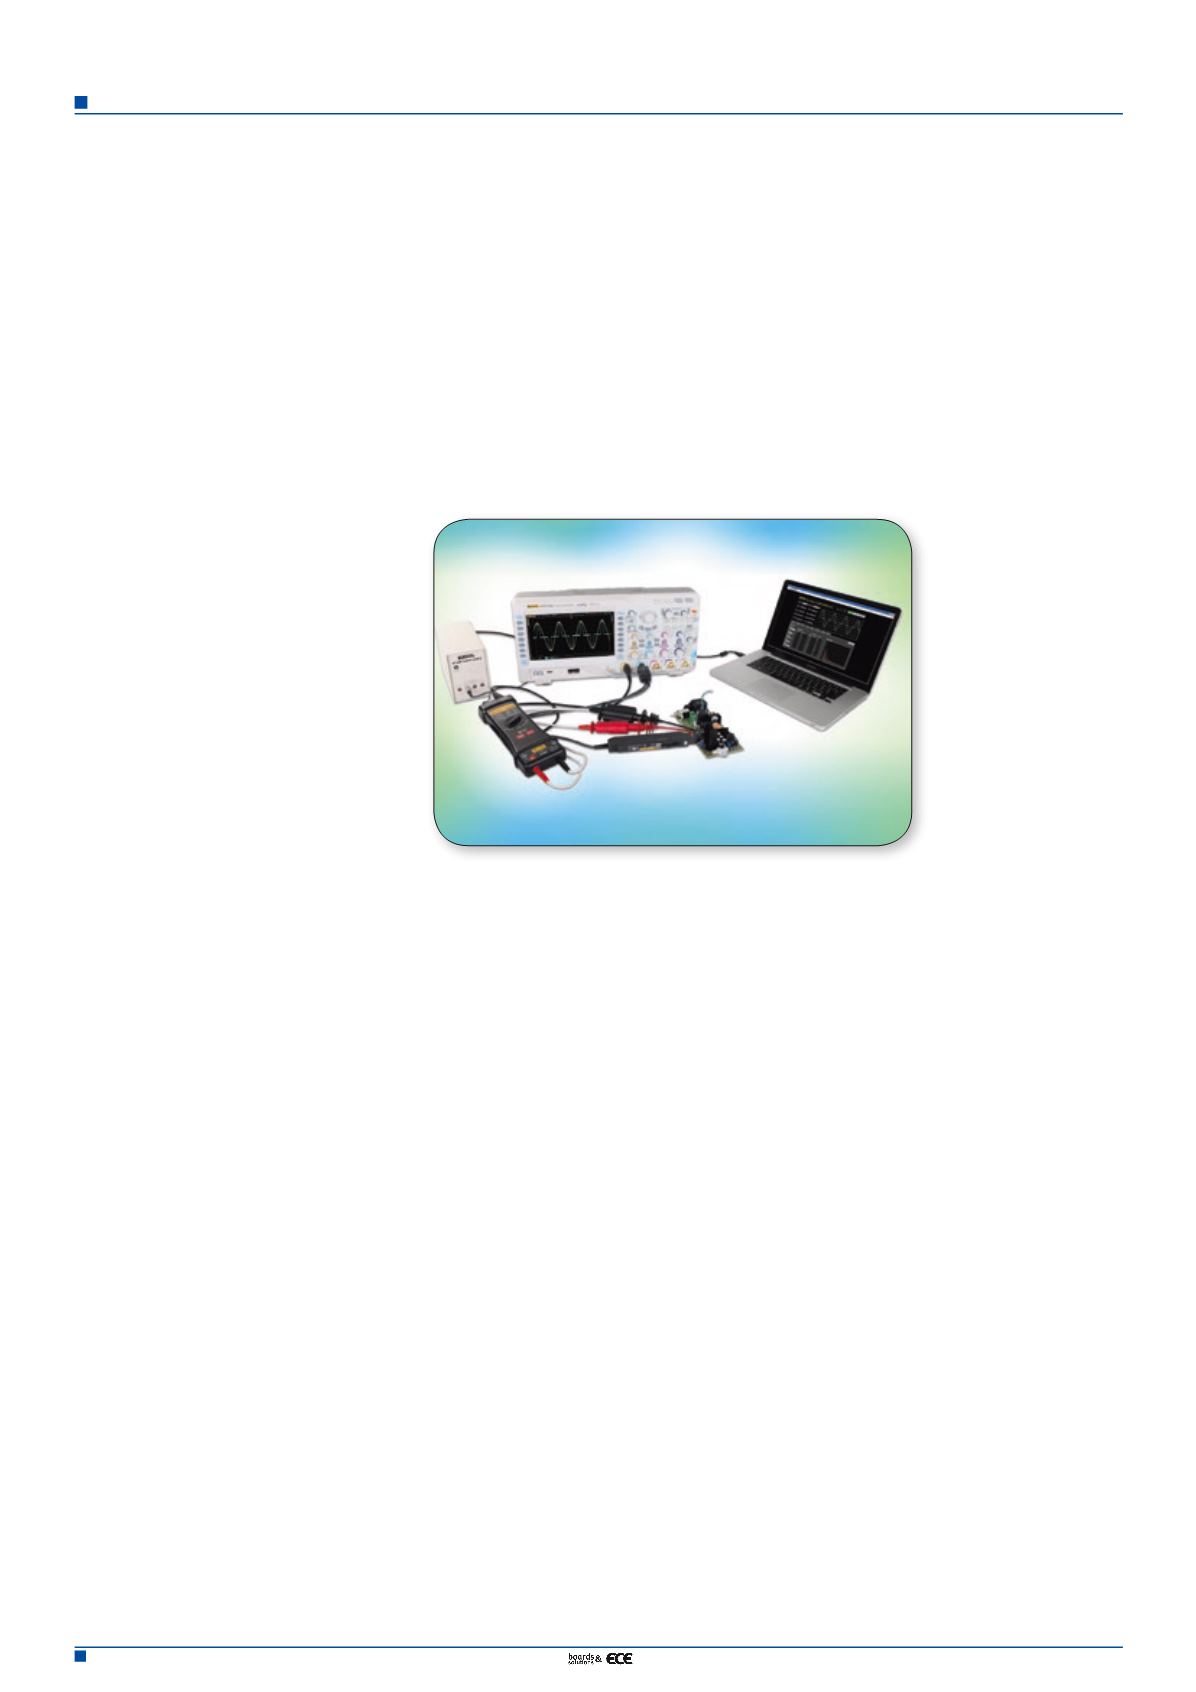
Power analyzer software for testing
switching power supplies with scopes
By Wolfgang Bartels,
Rigol
A power analyzer software
in combination with oscilloscopes
allows to set up small test systems,
which represent a reasonably priced
alternative for measuring switching
power supply parameters during
the development phase.
Switching power supplies are commonly
used in both the electronics and consumer
industry. For example, you will find switched
power supplies in TVs, computers, halogen
illuminations and in many other consumer
devices. Various parameters of these power
supplies have to be measured and compared
with limits during the development and
production phases. All built-in switching
power supplies must be compliant with the
European standard IEC61000-3-2. As with
EMI testing (CISPR-Norm), there is a split
between pre-compliance test (mostly during
the development phase) and compliance test
(certification).
Rigol is now able to offer a very competitive
pre-compliance test solution for the EMI field
as well as a solution for the power analysis.
The test system consists of special PC software,
an oscilloscope, as well as a current probe and
a voltage probe to connect to the test object.
There are three areas of measurements imple-
mented in the software: 1) measurements at
the input including power quality, harmon-
ics (IEC61000-3-2) and in-rush current; 2)
measurements at the switch including switch
loss, safe operating area, and modulation; 3)
measurements at the output which means
output analysis of the switching power supply.
An example is described below, the measure-
ment of harmonics and the harmonic current.
Before starting the measurements two steps
are necessary. 1) Demagnetization and zero-
ing of the probes, to ensure the accuracy of
the measurement. 2) Correction of the time
lag between current and voltage measure-
ment channels (channel deskew). Since a
time delay between the voltage and the cur-
rent probes can occur (channel 1 and chan-
nel 2 on the oscilloscope) causing inaccuracy,
calibration is required. With the calibration
RPA246 adapter and the Ultra Power Ana-
lyzer software calibration can be performed
automatically. For this purpose, a pulse sig-
nal is simultaneously recorded with the volt-
age probe and the current probe and the time
difference between the two detected signals
determined on an oscilloscope. These values
are stored in the software to use for later mea-
surements. They can be saved and reloaded
the next time you start, otherwise the offset
calibration must be performed again.
The voltage/current supply of the adapter
RPA246 correction is provided with an oscil-
loscope or a PC via a USB cable. There are two
connection options (one large and one small
current loop), depending on which current
probe is used (maximum cable diameter and
maximum measuring current). As already
mentioned, the most important measurement
tasks which are needed for testing switching
power supplies are integrated in Ultra Power
Analyzer software. For this purpose, you will
find among other things a graph, online help,
and how or where the probes must be con-
nected for the selected measurement. Figure
1 shows a configuration example for the mea-
surement of input parameters, such as power
quality, harmonics or in-rush current. The
user can activate the display of the graph by
setting tips on or off.
Once all the preparations are done and the
test set-up is fixed, you can begin to per-
form the measurements. Depending on the
selected measuring, some parameters need
to be supplemented. The measurement of
harmonic currents requires additional infor-
mation as follows. 1) Mains frequency, which
is important as the basis of the assessed har-
monics. 2) Definition of the test object class
by IEC61000-3-2. The standard test is divided
into four different classes of objects (A to D).
Each class must be evaluated according to dif-
ferent limits. By selection of the class, the soft-
ware limits are adjusted automatically. 3) Type
of the measured harmonics: even number (x2,
x4, x6..), odd (x3, x5, x7..) or all harmonics
of the fundamental wave. 4) Display: repre-
sentation as a measurement, a curve (FFT) or
as a bar graph. When selecting bar chart the
actual measurements are shown (green) and
the limits of the standard are shown (blue).
5) Definition of the window function. It may


