April 18
11
E
mbedded
C
omputing
thermal storage capacity of the heavy cool-
ing element in comparison to the relatively
low power of 45W dissipation of the COM
express module. Even small disturbances,
such as the entrance of laboratory personnel
into the climate chamber, are evident on the
measurement curves. The conditioning sys-
tem of the climate chamber proves to be a
major interference factor.
This conditioning system uses multiple fans
to circulate the climate chamber air, result-
ing in an air temperature distribution that is
as homogeneous as possible. Air movements
caused by this process increase the heat trans-
fer on the cooling element, which results in tri-
als that achieve very low temperatures for the
electronic components during conditioned
operation. For this reason, the additional tests
are carried out in the climate chamber with
protection from outside influences and with
the conditioning system switched off. Mea-
sured values attained this way for the cool-
ing system and, in particular, for the thermal
resistance of the cooling element are a better
match with the manufacturer specifications
and simulation results. The measurement
results are visualized using the example of
two different cooling elements that have sig-
nificantly different shapes. On one hand, clear
differences in the measured values are to be
expected, which simplifies the comparison
with simulations. Secondly, this setup allows
for observation of how well the simulation
tool deals with the unique features of the
various components. The Schroff-manufac-
tured flat and wide cooling element featuring
even fins is a production-oriented model that
roughly meets the cooling requirements men-
tioned. The comparison model is a tall and
short element from the market with shaped
fins. Based on the manufacturer specifications,
it is clear from the beginning that this model
will provide substantially lower cooling per-
formance. However, it will be interesting to
use this element to learn whether the simula-
tions are able to reproduce the cooling effect
of the fins with sufficient accuracy. According
to the data sheet from the manufacturer, the
cooling element has a thermal resistance of
approximately 0.8K/W, assuming horizontal
mounting and unobstructed convection.
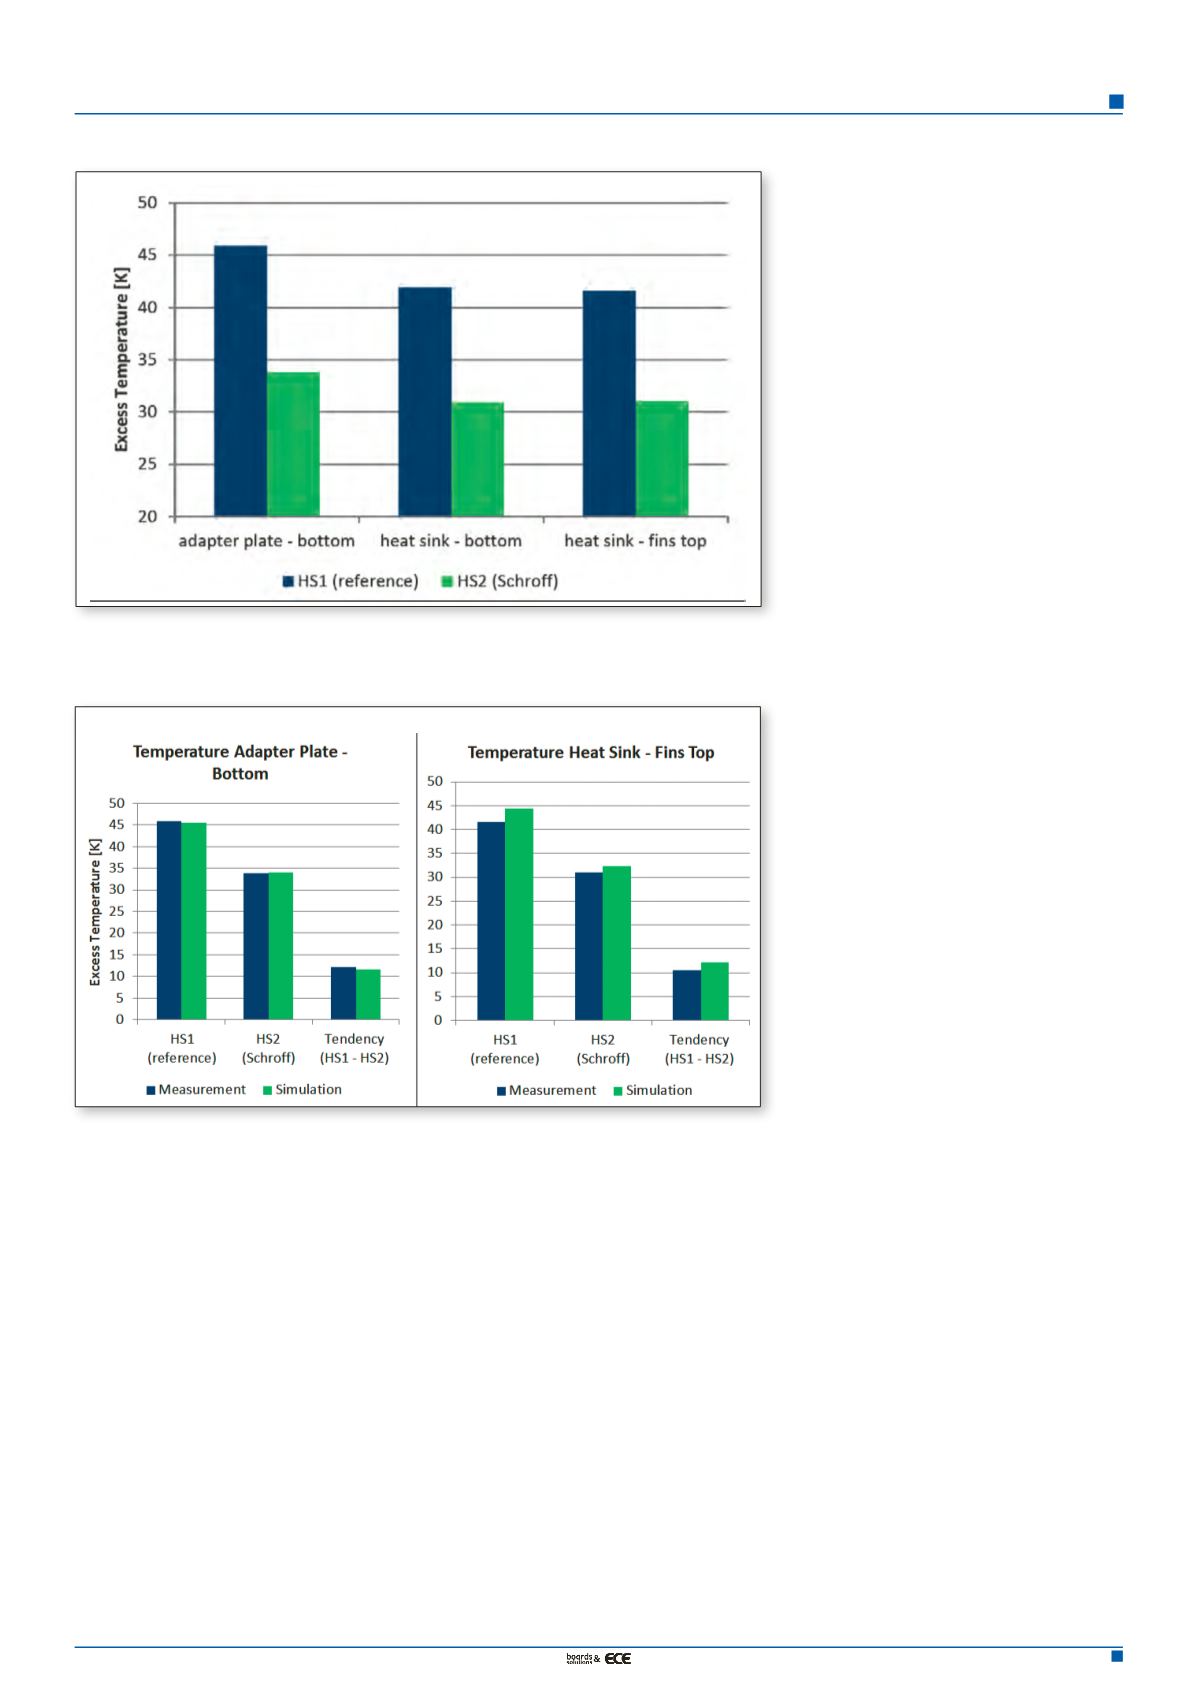
An initial look at the test results (figure 2) for
the series-oriented cooling element makes it
clear that the surface temperature at the top
of the fins is just over the 50°C required at
an ambient temperature of 20°C, the same
result that was inferred from looking at the
design calculations. The comparison cool-
ing element very clearly exceeds this require-
ment. The surface temperature at the end of
the fins would reach more than 65°C. It is
also important to note here that the thermal
resistance of the comparison cooling element
is below the specified value of 0.8K/W. The
measurements yielded a resistance of a little
more than 0.9K/W. This is presumably due
to the fact that the entire bottom side of the
element is not connected to the heat source,
and instead the element is connected only
through the surface of the adapter plate. It is
interesting to note here that the glass-fiber-re-
inforced gap filler between the cooling ele-
ment and the adapter plate causes differences
in the temperature reduction between the ver-
sions. Obviously, it is difficult to guarantee the
same heat termination over the foil in all cases.
Lower fluctuations can be achieved when
softer foils without glass-fiber reinforcement
are used. The differences for the reinforced
foils, however, are reduced to a low enough
level overall that the advantages of working
with them outweigh the aforementioned dis-
advantage.
Figure 3 shows a comparison of the simula-
tion results and physical measurements for
the versions described. It is easy to see that the
simulations are quite capable of predicting
the physical measurements. This is only pos-
sible using an adequate configuration of the
material properties in the simulation model.
This means that the simulation model is capa-
ble of reproducing the tendencies accurately
with a maximum deviation of 1.5K, which
is crucial for variant comparison. It is also
capable of calculating the absolute values of
the temperatures with sufficient accuracy and
with an absolute deviation below 3K, which
corresponds to a relative tolerance of maxi-
mum 7%. This allows for a precise design of
the system to meet specific requirements.
n
Figure 2. Measurement results for the over-temperature (measured temperature relative to the
ambient temperature) for the comparison element (KK1) and the series-oriented Schroff cooling
element (KK2).
Figure 3. Comparison of the measurement results on the adapter plate and the fin temperature for
the two cooling elements


