February 2016
30
T
ools
& S
oftware
When the debugger becomes the
basic tool for integration and testing
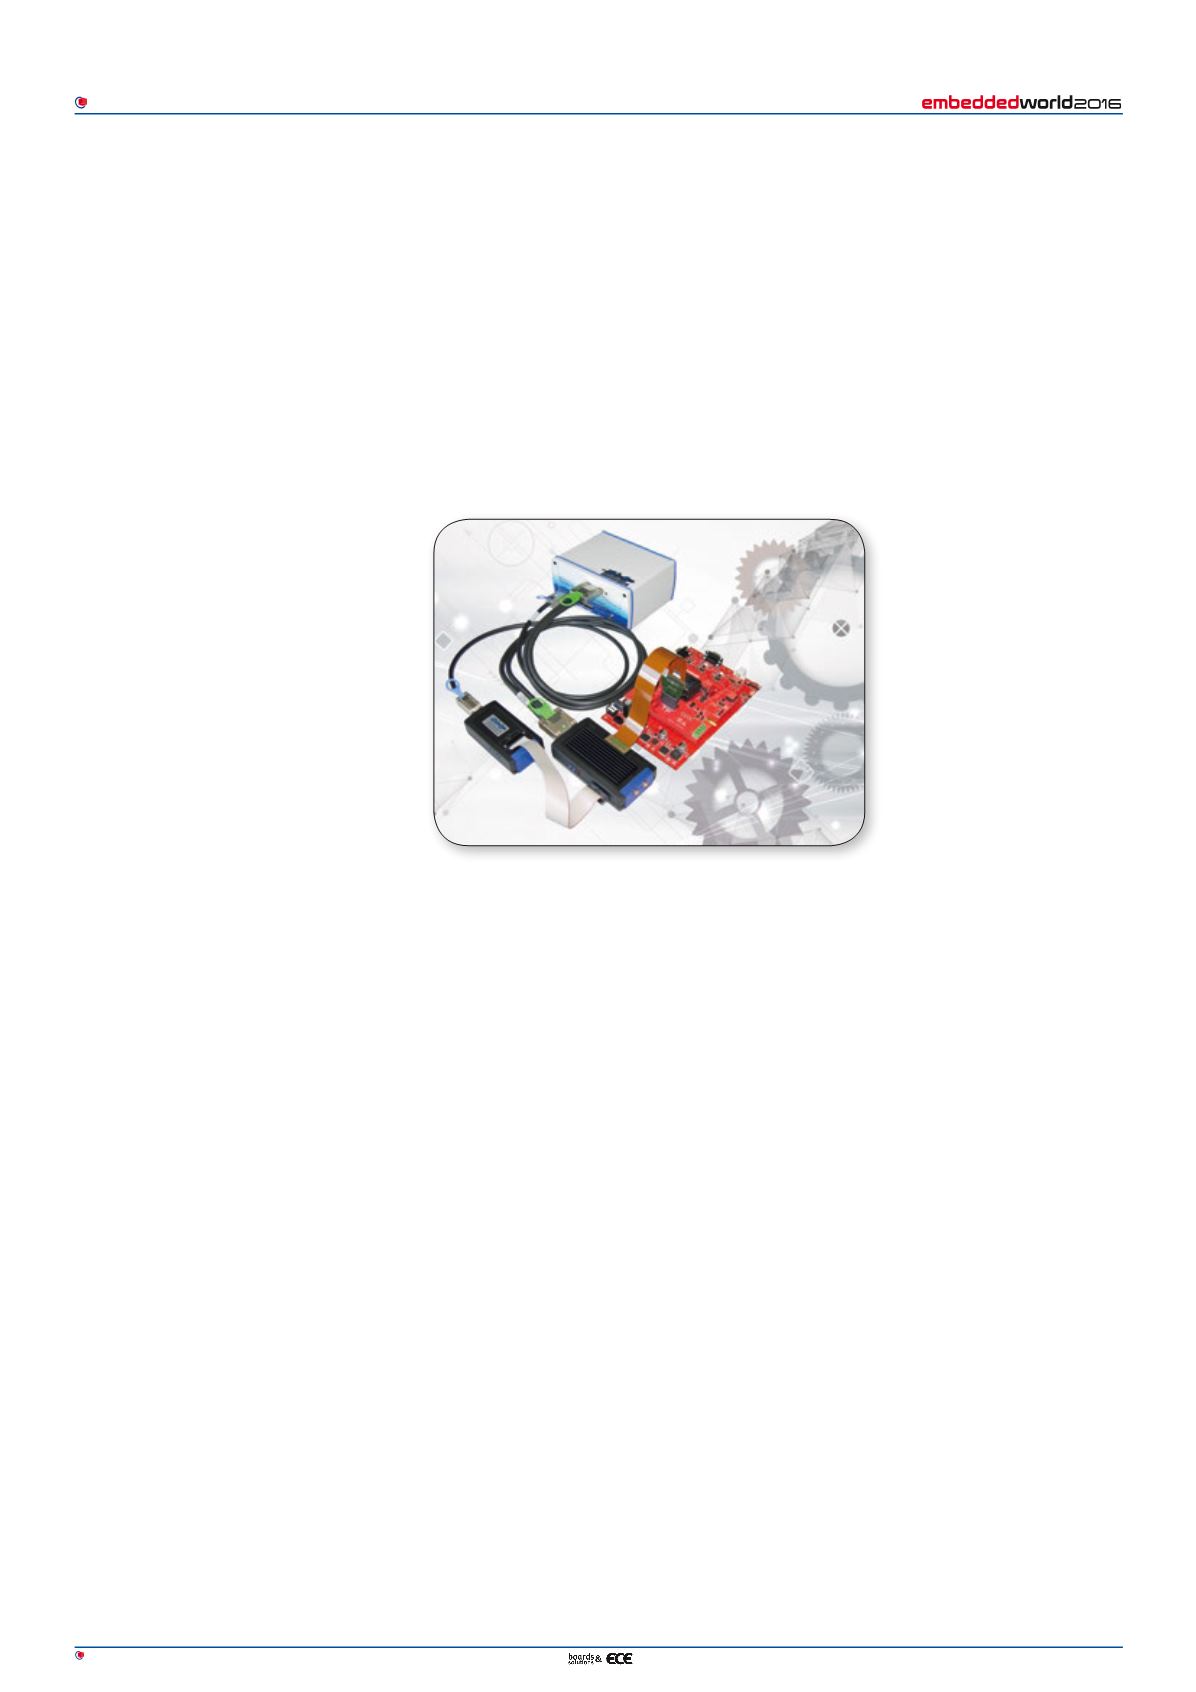
By Heiko Riessland,
PLS
To ensure even better control
of the very large volumes of data
with embedded software nowadays,
a new generation of debuggers is
needed, which will provide users with
extensive testing capabilities at the
system level through to automated
report generation, in addition to
classic basic functions.
Complex embedded software programs,
with several hundreds of megabytes of source
code and constantly growing quality demands,
increasingly require highly automated test
programs. Such innovative testing meth-
ods are even essential for reliably bringing
together individual software parts when the
development is carried out by large teams
that are based at different locations. In certain
cases, they are in the meantime even manda-
tory through relevant standards, such as the
automotive standard ISO 26262.
However, the desired effectiveness can only
be achieved if the debugger used also actually
fully provides its functionality and its graph-
ical user interface in an appropriate form for
automated testing. A tool is needed for this
that besides the classic debugger features, for
example, control and monitoring of the target
with a wide range of possibilities for viewing
and analyzing, and also provides new capa-
bilities via a graphical user interface. The
complete functionality must also be usable in
semi- or fully-automated operation.
Regression testing is a typical example of such
processes that can run fully autonomously
with suitably equipped tools. For this purpose
tests for certain software functions are devel-
oped beforehand, for example, described by
inputs and outputs for functions or modules.
Such, ideally automated, test runs serve as
reliably proof of a specific functionality even
after several changes to the software. A third
program frequently takes over management
and control of the test cases with this type of
application. The actual user interface of the
debugger is therefore not used at all, only its
functionality.
In turn, semi-automated use of the debugger
is particularly interesting for the integration of
various software parts into a complete applica-
tion. The application is manually tested under
various operating conditions by operation
via the graphical user interface. Besides the
debugger, the control unit is still connected
to a complex hardware-in-the-loop (HIL)
system, which simulates the intended control
unit environment. One aspect is particularly
important in this context: scripts that use the
debugger functionality can immediately pro-
vide a detailed report about the state of the
target and the application software whenever
anomalies or errors occur. At the same time,
for example, at the location of a breakpoint in
an error or trap function, all relevant variables,
registers, memory contents, etc are stored for
analysis or subsequent reverification of the
software. Furthermore, with software that is
running correctly, a script for automated code
coverage analysis can, in the ideal situation, be
started by means of predetermined functions.
Code coverage is a method for measuring the
test coverage and thus an indirect determina-
tion of the software quality and is stipulated in
relevant standards, such as ISO 26262. At the
same time, it is determined whether during
testing all instructions (statement coverage)
and branches (branch coverage) or different
logical connections (modified condition/deci-
sion coverage, MC/DC) will run within soft-
ware. A complete MC/DC analysis is mostly
only possible with code instrumentation and
thus accompanying change of the runtime
and size of the application. Applications, for
which this variant are out of the question for
technical reasons, instead usually use trace
data-based branch coverage obtained in real-
time. Provided compilers with enhanced
debug information are available, a complete
branch coverage analysis is possible, even on
highly optimized code.
In this case, the debugger not only takes over
control of the target and capture/analysis
of trace data, it also generates an automated
report, which in turn ensures reliable docu-
mentation and repeatability of the measure-
ments. Display of the code coverage is possible
for the level function, line number in the
source code and also machine instruction. In
the extract shown, the source text is displayed.
It is possible to navigate to the machine code
level via generated links on the line numbers.


